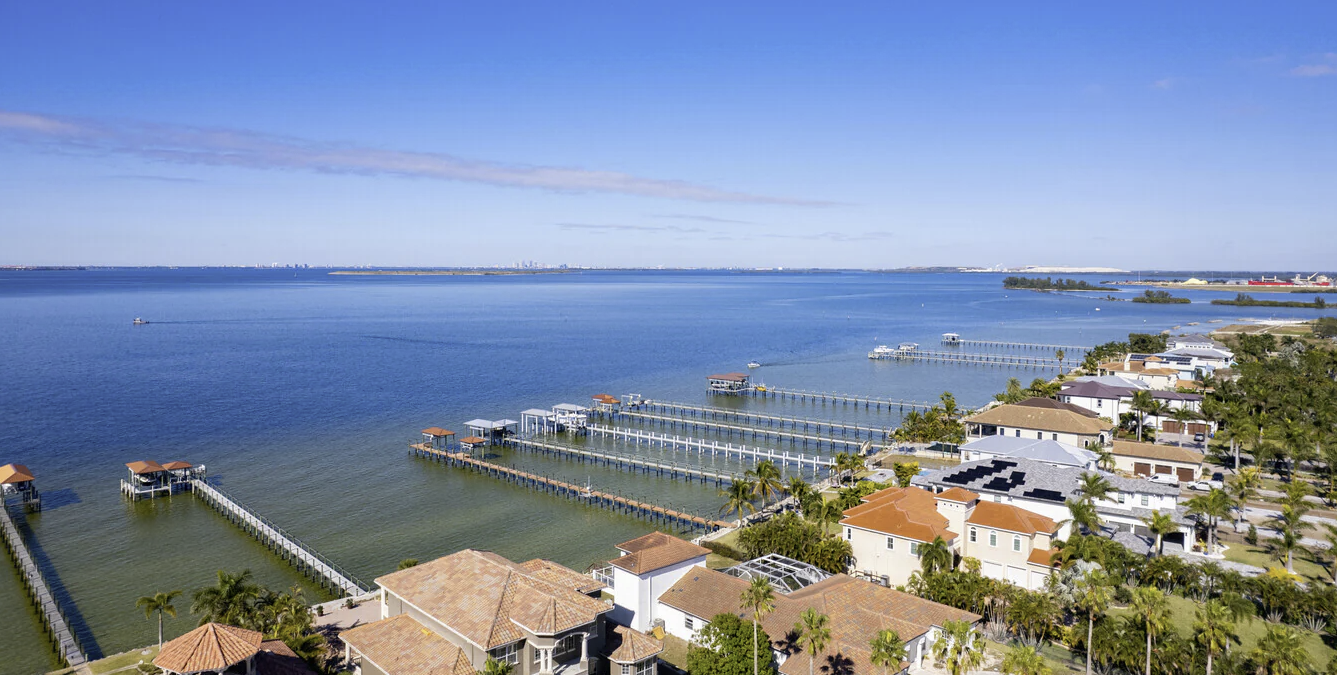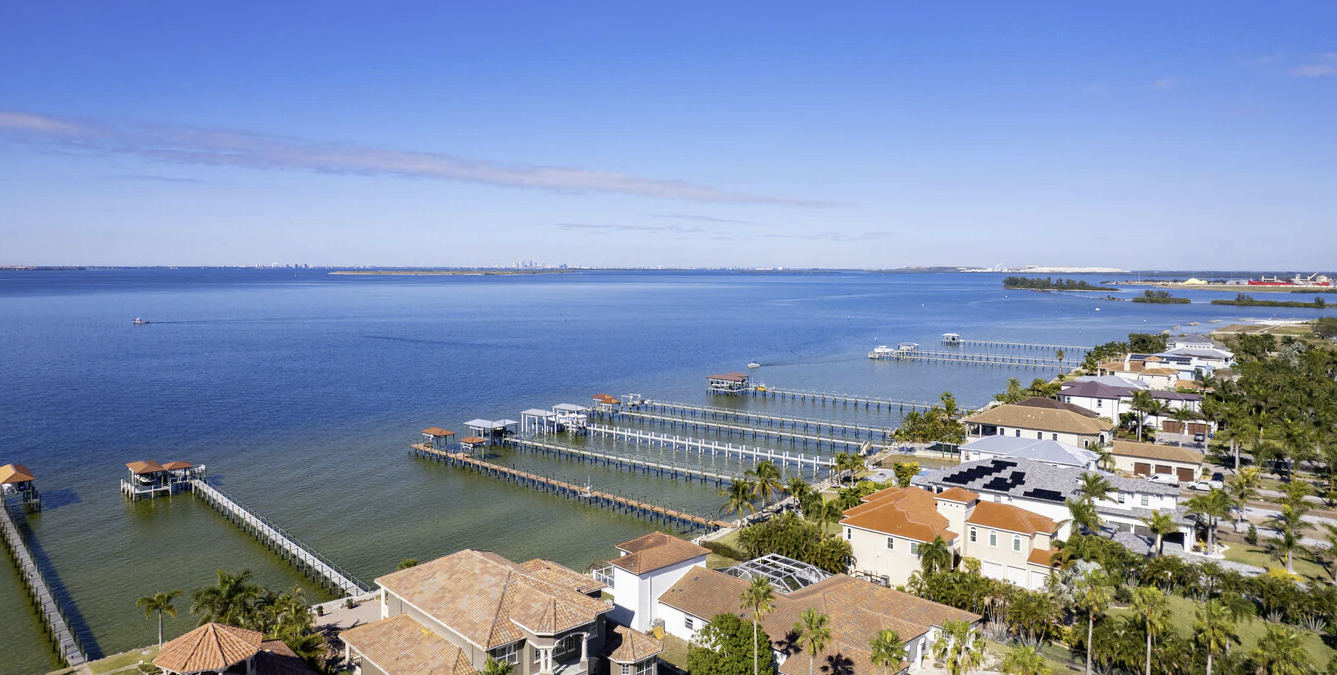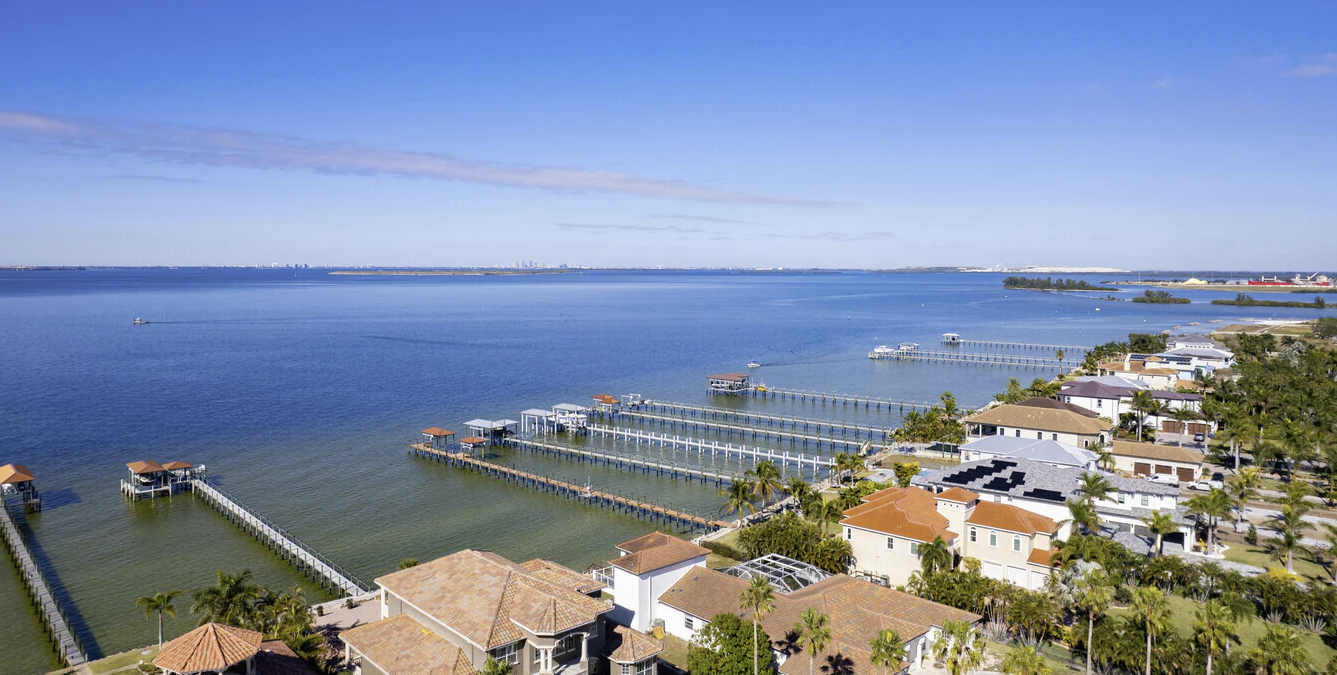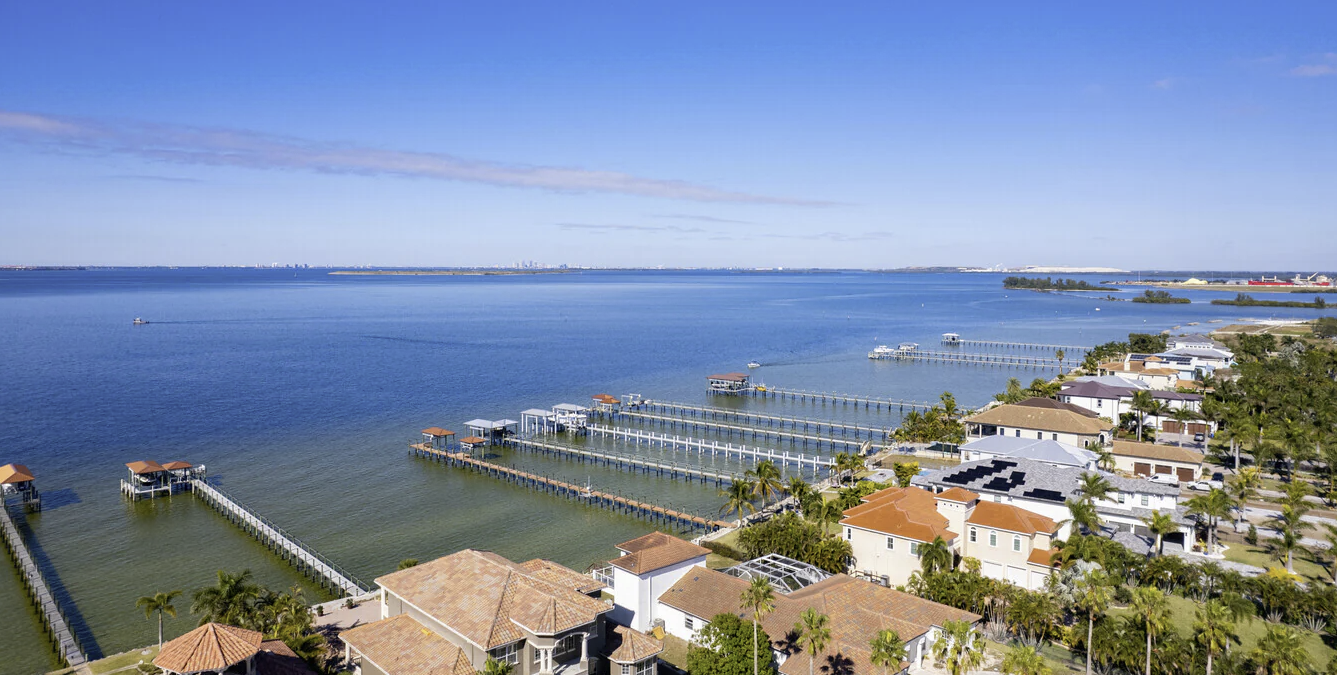
Apollo Beach FL combines waterfront scarcity with strong military rental demand, creating an investment market where the right property type and exit strategy determines whether you earn 5% gross yields or lose money to insurance costs. This guide breaks down what actually works for investors in 2026: which neighborhoods pencil out, what rents look like by property type, and how MacDill AFB proximity changes the tenant pool.
Quick Answer
Apollo Beach investment properties return 4-6% gross yields on canal homes, 5-7% on non-waterfront rentals, and 6-8% on multifamily near US-41. Insurance costs ($6,500-$14,000/year combined homeowners and flood) are the biggest risk variable. MacDill AFB military tenants create low vacancy on 3BR+ homes in the $2,200-$3,200/month rent range. Non-waterfront Waterset-area homes offer the most predictable rental math. Waterfront appreciation is the better play for long-term wealth building.
Four Investment Strategies That Work in Apollo Beach
Apollo Beach does not work for every investor approach. Here is what the market actually supports:
Strategy 1: Long-Term Waterfront Rental (Hold for Appreciation)
Canal-front and open bay homes in the $580,000-$1,100,000 range rarely pencil out on yield alone. Monthly rent on a canal home is $3,200-$4,500. At a $750,000 purchase price with 25% down, your monthly PITI plus insurance is approximately $5,200-$6,000. That is negative cash flow of $700-$1,800 per month before maintenance.
The investment case is appreciation. Apollo Beach waterfront has appreciated 40-55% over the past five years. Investors holding waterfront for 7-10 years have captured significant equity gains. If you need current cash flow, waterfront is not the play. If you can absorb a monthly carry cost while building equity in a supply-constrained asset, waterfront makes long-term sense.
Who it fits: High-income earners who can offset carry costs, investors with 30-40% down to reduce monthly payments, buyers targeting 1031 exchange into a more valuable asset class.
Strategy 2: Non-Waterfront Family Rentals (Cash Flow Focus)
Non-waterfront homes in Waterset, BonaVista, and the US-41 corridor in the $380,000-$550,000 range offer the cleanest rental math in Apollo Beach. A $420,000 home with 25% down at 7% returns rent of $2,400-$2,800/month. Monthly PITI runs approximately $2,800-$3,100. Insurance on a non-waterfront home averages $2,800-$4,500/year (homeowners only, no mandatory flood). Total carrying costs land at $3,000-$3,400 depending on property tax rate.
At $2,600-$2,800 in rent, you are close to break-even with low vacancy. The story gets better with higher down payments. At 30-35% down, non-waterfront rentals generate $200-$500/month positive cash flow before maintenance reserves. The tenant pool is strong: MacDill workers, Waterset families, South Shore commuters who want Apollo Beach's waterfront lifestyle without the waterfront price.
Who it fits: Investors seeking modest current cash flow, buyers who want newer construction (Waterset homes are 2017-2026), buyers targeting families or military tenants.
Strategy 3: Value-Add Renovation (Forced Equity)
Apollo Beach's older canal-front inventory from the 1960s-1980s presents value-add opportunities. Unrenovated CBS canal homes sell in the $480,000-$650,000 range. A $40,000-$80,000 renovation (kitchen, baths, flooring, dock, seawall inspection) can push resale value to $750,000-$950,000. The gap depends heavily on seawall condition and dock quality.
Before pursuing value-add waterfront, budget for seawall inspection ($200-$400) and potential seawall replacement ($15,000-$35,000 for 100 feet, concrete cap style). A failed seawall wipes out renovation profit. CBS construction from the 1970s is generally solid. The flip risk in Apollo Beach is underestimating dock/seawall costs and overestimating ARV in a slower market for unrenovated waterfront.
Who it fits: Investors with renovation experience, access to reliable contractors in the Tampa area, and cash reserves to fund seawall work if needed.
Strategy 4: Buy-and-Hold for Appreciation (Non-Waterfront)
Waterset is Apollo Beach's most institutionally-friendly sub-market. New construction Waterset homes from DR Horton, Lennar, and Homes by WestBay are coming off warranty cycles and entering the resale market. These 2017-2022 builds at $380,000-$550,000 have appreciated 30-40% since construction and have 10-15 years of deferred renovation ahead of them.
Waterset HOA fees run $120-$200/month covering amenity maintenance. The community has three amenity centers, resort pool, water slides, dog parks, and Waterset Charter School K-8 within the community. School quality and amenities drive tenant quality and resale demand. Long-term Waterset appreciation tracks Hillsborough County broadly plus a quality premium.
Who it fits: Investors targeting newer construction, buyers who want low near-term maintenance, investors who want the Waterset school zone as a tenant qualifier.
Rental Return Table by Property Type (2026)
| Property Type | Price Range | Monthly Rent | Gross Yield | Net Yield Est. | Typical Tenant |
|---|---|---|---|---|---|
| Canal home (entry) | $550K-$750K | $3,000-$3,800 | 4.8-6.2% | 1.5-3.0% | Military officers, professionals |
| Canal home (renovated) | $850K-$1.3M | $4,200-$5,500 | 4.2-5.8% | 1.0-2.5% | Senior officers, executives |
| Open bay / MiraBay | $1.0M-$3.0M+ | $5,000-$9,000 | 3.6-5.2% | 0.5-2.0% | Executives, corporate relocations |
| Waterset (non-waterfront) | $390K-$580K | $2,400-$3,000 | 5.5-7.2% | 2.5-4.0% | Military families, young professionals |
| Non-waterfront (US-41 corridor) | $380K-$520K | $2,200-$2,800 | 5.2-6.8% | 2.0-3.8% | Mixed, South Shore workers |
| Townhome / villa | $280K-$380K | $1,800-$2,300 | 6.0-7.5% | 3.0-4.5% | Singles, couples, military junior enlisted |
Net yield estimates deduct property taxes (~1.8% of purchase price), insurance, HOA, and 10% management fee. Exclude maintenance reserves. 2026 estimates based on current market conditions.
MacDill AFB Military Tenant Demand
MacDill Air Force Base sits 12-15 minutes north of Apollo Beach via US-41. It employs approximately 15,000 military and civilian personnel. Military families on BAH (Basic Allowance for Housing) are among the most reliable tenants in any military market: they receive housing allowance regardless of deployment, they have income verification through military pay records, and they have financial consequences for defaulting on rent.
Apollo Beach BAH Rates (2026)
BAH rates for MacDill AFB vary by rank and dependent status. Approximate 2026 monthly rates for common ranks with dependents:
| Rank | Approximate BAH (w/dependents) | Target Rental Range |
|---|---|---|
| E-4 to E-6 | $2,000-$2,400 | Townhomes, smaller 3BR |
| E-7 to E-9 | $2,400-$2,900 | Waterset homes, non-waterfront 3-4BR |
| O-3 to O-4 | $2,800-$3,300 | Larger Waterset homes, entry canal |
| O-5 to O-6 | $3,200-$3,800 | Canal homes, larger non-waterfront |
BAH rates are set by DoD annually and vary by zip code. These are approximations for the 33572 zip code area. Verify current rates at the official DoD BAH calculator.
What Military Tenants Look For
Military families relocating to MacDill typically want 3-4 bedrooms to accommodate families, a garage (important for deployed families storing vehicles), a yard for pets and children, and proximity to base under 20 minutes. Apollo Beach checks all these boxes. The average military PCS (Permanent Change of Station) assignment is 2-3 years, meaning you will have tenant turnover but predictable cycles.
Properties near Apollo Beach Boulevard and within the Waterset community typically lease to military families within 2-3 weeks of listing. Canal homes at $3,200-$4,000/month can sit 30-60 days finding the right officer-rank tenant. Price your rental at BAH-rate ranges for your target rank bracket, not above.
Lease Timing and Military Clauses
Florida landlords leasing to active-duty military must honor the Servicemembers Civil Relief Act (SCRA), which allows military tenants to break leases with 30 days' notice if they receive PCS orders. This is not a reason to avoid military tenants. The SCRA clause is standard, and military tenants are statistically among the lowest eviction-risk tenants. The income source (DoD) does not default. Vacancy between military tenants is brief in the current market. Many military families recommend Apollo Beach rentals to incoming colleagues, creating a word-of-mouth referral network.
Insurance Costs and Investor Yields
Florida property insurance is the single biggest variable in Apollo Beach investor math. Rates have increased 40-80% since 2020 for coastal properties and there is no sign of reversal. Budget insurance costs before signing any purchase contract.
Insurance Cost Ranges by Property Type (2026)
| Property Type | Homeowners Insurance | Flood Insurance | Combined Annual | Monthly Impact |
|---|---|---|---|---|
| Canal home (older, unrenovated) | $5,000-$9,000 | $3,000-$6,000 | $8,000-$15,000 | $667-$1,250 |
| Canal home (post-2004 construction) | $3,500-$6,000 | $2,500-$4,500 | $6,000-$10,500 | $500-$875 |
| MiraBay home | $4,000-$7,500 | $2,000-$5,000 | $6,000-$12,500 | $500-$1,042 |
| Non-waterfront (no flood required) | $2,500-$4,500 | $0-$800 | $2,500-$5,300 | $208-$442 |
| Waterset community home | $2,200-$3,800 | $0-$600 | $2,200-$4,400 | $183-$367 |
How to Minimize Insurance Costs
Apollo Beach investors who buy pre-loss-mitigation properties pay the highest insurance rates. Here are the factors that reduce rates:
- Post-2004 wind mitigation compliance: Florida Building Code 2004 and newer construction gets discounts of 20-40% on wind coverage. Ask for the wind mitigation inspection report on any property built before 2004.
- Hip roof vs gable roof: Hip roofs (sloped on all four sides) carry lower premiums than gable roofs. Most newer Apollo Beach construction uses hip roofs.
- Elevation certificate: If the property has an elevation certificate showing base floor above BFE (Base Flood Elevation), flood insurance costs drop substantially. Request the elevation certificate before making an offer on waterfront.
- Private flood insurance: FEMA NFIP flood insurance has annual premium caps and can be significantly more expensive than private flood markets. Get quotes from both before assuming NFIP is your only option.
- New construction: Waterset homes built 2017-2024 carry the lowest insurance costs in Apollo Beach due to current building code compliance and inland location relative to bay.
Waterfront vs Non-Waterfront: Investment Comparison
| Factor | Waterfront Canal | Non-Waterfront |
|---|---|---|
| Gross yield | 4-6% | 5.5-7.5% |
| Net yield (after expenses) | 1-3% | 2.5-4.5% |
| 5-year appreciation (historical) | 45-60% | 30-45% |
| Insurance cost (monthly) | $500-$1,250 | $183-$442 |
| Vacancy rate | 3-6% (longer to find right tenant) | 2-4% (military demand is strong) |
| Maintenance complexity | High (dock, seawall, salt air) | Standard |
| Tenant profile | Officers, executives | Military families, professionals |
| Best investor goal | Long-term appreciation, equity | Cash flow, predictable returns |
| Down payment needed to cash-flow | 35-40%+ or rarely | 25-30% |
Investment Neighborhoods Breakdown
Canal-Front Core (Pre-1990 Inventory)
The original Apollo Beach canal network built in the 1960s-1980s offers the deepest-draft canals and most direct bay access. These CBS homes (concrete block stucco construction) are generally structurally solid, but many have dated interiors, aging seawalls, and old electrical panels. They sell in the $480,000-$750,000 range depending on renovation status and canal position (fingers vs main canal).
For investors: the unrenovated stock is where value-add opportunity lives. Renovated homes in this area sell $750,000-$1,100,000 with the right position and dock. Rental returns on renovated canal homes run 4.5-5.5% gross. The main canal properties with bay access generate premium rents. Seawall condition is the decisive underwriting factor.
MiraBay (Gated, Premium)
MiraBay is Apollo Beach's most upscale community: gated, with a clubhouse, resort-style pool, fitness center, and boat launch ramp. Homes sell from the mid-$600,000s (smaller non-waterfront villas) to over $2,000,000 (large bay-front). MiraBay HOA runs approximately $160-$250/month on top of CDD fees ranging $1,500-$2,500/year.
For investors: MiraBay carries a 10-20% price premium over comparable canal homes outside the gate. Gross yields run 3.5-5.5%. The premium is real for tenant quality (executive relocations, senior officers) but yields are thinner. MiraBay is more of an appreciation play than a cash flow play. Vacancy is lower because the community itself is a draw. The gate and amenities mean tenants accept the premium willingly.
Waterset (Non-Waterfront, New Construction Resale)
Waterset is the highest-volume sub-market in Apollo Beach for investors who want predictable rental math. The community has 3,000+ homes built primarily 2015-2026 by DR Horton, Lennar, Meritage Homes, and Homes by WestBay. Current resale prices run $390,000-$700,000 depending on size, lot, and builder tier.
Waterset investors benefit from: newer construction (lower maintenance cost), Waterset Charter School K-8 within walking distance (tenant qualifier), three amenity centers creating community stickiness, and Sumner High School zoning (newer HS, good for tenant families). HOA is approximately $120-$200/month covering amenities. No CDD fees for most Waterset parcels (check individual listings).
Rental rates in Waterset: 3BR at approximately $2,300-$2,700/month, 4BR at $2,600-$3,100/month, 5BR at $3,000-$3,500/month. Military families from MacDill constitute a significant share of Waterset tenants.
BonaVista and Harbour Isles
BonaVista is a small established community near Apollo Beach Boulevard offering older, more affordable homes in the $380,000-$500,000 range. No CDD fees. HOA is minimal or absent on some streets. These homes are 1990s-2000s vintage and offer the lowest entry point in Apollo Beach for non-waterfront investment.
Harbour Isles is a gated community with a mix of lake-view and non-lake homes at $380,000-$560,000. HOA approximately $115-$165/month. The community has amenities including a pool and fitness center. These homes attract the same military and professional tenant pool as Waterset but at slightly lower rents ($2,100-$2,700/month) due to the older vintage and smaller lot sizes.
How Apollo Beach Compares to Other South Hillsborough Investor Markets
| Market | Entry Price | Gross Yield Range | Insurance Cost | Investor Strength | Weakness |
|---|---|---|---|---|---|
| Apollo Beach (waterfront) | $550K+ | 4-6% | $500-$1,250/mo | Strong appreciation | High insurance, thin yield |
| Apollo Beach (non-WF) | $390K+ | 5.5-7.5% | $183-$442/mo | Military demand, new construction | Price run-up limiting yield |
| Ruskin | $290K+ | 6.0-8.0% | $200-$600/mo | Lower entry, higher yield | Lower appreciation, older stock |
| Wimauma | $295K+ | 6.5-8.5% | $150-$350/mo | New construction, CDD concern | Long Tampa commute, CDD fees reduce yield |
| Riverview | $350K+ | 5.5-7.0% | $150-$350/mo | I-75 access, large inventory | High competition, many similar rentals |
| Gibsonton | $270K+ | 6.5-8.5% | $150-$400/mo | Lowest entry in area | Flood zone risk, infrastructure concerns |
Bottom line: Apollo Beach non-waterfront (Waterset, BonaVista) competes with Riverview on yield while offering stronger tenant quality through the MacDill military pipeline. Ruskin and Wimauma offer higher gross yields but at lower quality tenants and more maintenance complexity. Waterfront Apollo Beach is in a category of its own: it is an appreciation asset, not an income asset.
Property Management Considerations
Self-managing an Apollo Beach rental from a distance is difficult. The military tenant pipeline requires good communication (PCS orders can accelerate move-in timelines), and waterfront maintenance requires local contractor relationships that take time to build.
ViVi Property Management handles investment properties in Apollo Beach and the broader South Hillsborough area. Learn more about South Shore property management options here. For investors who are serious about the Apollo Beach market, working with a manager who already has local contractor relationships and understands the military tenant process is worth the 8-10% management fee — that cost is already built into the net yield estimates in the table above.
What Good Property Management Handles
- Military tenant screening and BAH verification
- SCRA compliance (military lease break provisions)
- Dock and seawall inspection coordination
- Post-storm inspection and insurance claim coordination
- Handling PCS turnover efficiently (military tenants have firm move-out dates)
- Competitive rent pricing in a market where military BAH caps set the ceiling
Investor Buyer Checklist for Apollo Beach
Before making an offer on an Apollo Beach investment property, verify these items:
Waterfront Properties
- Seawall inspection: Budget $200-$400 for inspection. Know the condition before making an offer, not after. Seawall replacement is $15,000-$35,000+ and not covered by standard homeowners insurance.
- Elevation certificate: Request from the seller or order one yourself. This determines flood insurance cost — the biggest variable in your insurance budget.
- Dock condition and permits: Ask for dock permits. Unpermitted docks create liability. Dock replacement or permitting costs $8,000-$30,000 depending on size and materials.
- Canal clearance: Confirm water depth at mean low water for your planned boat size. Canal fingers in the older Apollo Beach network vary significantly in depth.
- Private flood insurance quotes: Get at least two private flood quotes before assuming NFIP is your only option. Private market can be 20-40% cheaper on some properties.
Non-Waterfront Properties
- CDD fee verification: Ask the HOA or look at the Hillsborough County tax records for CDD assessment. Not all Apollo Beach properties have CDD fees, but many Waterset and newer community homes do. CDD fees of $1,500-$2,500/year reduce net yield.
- Wind mitigation inspection: Order a wind mitigation inspection on any home built before 2004. The savings on homeowners insurance can be $800-$2,000/year.
- Rental restriction review: Some HOAs have minimum rental periods or require HOA approval for tenants. Review the CC&Rs for the specific community. Waterset has a 30-day minimum rental period.
- School zone confirmation: Confirm the exact school zone, not just the neighborhood name. School zones affect tenant quality and can change due to rezoning.
- Rental comp pull: Pull 6 months of actual rental comparable data for the specific neighborhood before projecting rents. The zip code 33572 spans from Waterset to the canal core — rents vary significantly by sub-location.
Frequently Asked Questions About Apollo Beach FL Investment Properties
Talk to Barrett About Apollo Beach Investment Properties
Barrett Henry is a Broker Associate at REMAX Collective with 23+ years of real estate experience and deep knowledge of the Apollo Beach investment market. Whether you are evaluating your first rental property or expanding a portfolio in South Hillsborough County, Barrett can provide rental comp data, insurance estimates, and realistic underwriting for specific properties you are considering. Contact Barrett directly here.